






Baby food quality is not a price label. A new analysis of Ghana’s 2022 survey asks three separate questions about drinks, foods and missing vegetables or fruit. For Nigerian parents, the useful application is an evidence-aware review—not a claim that a premium basket guarantees a better diet.
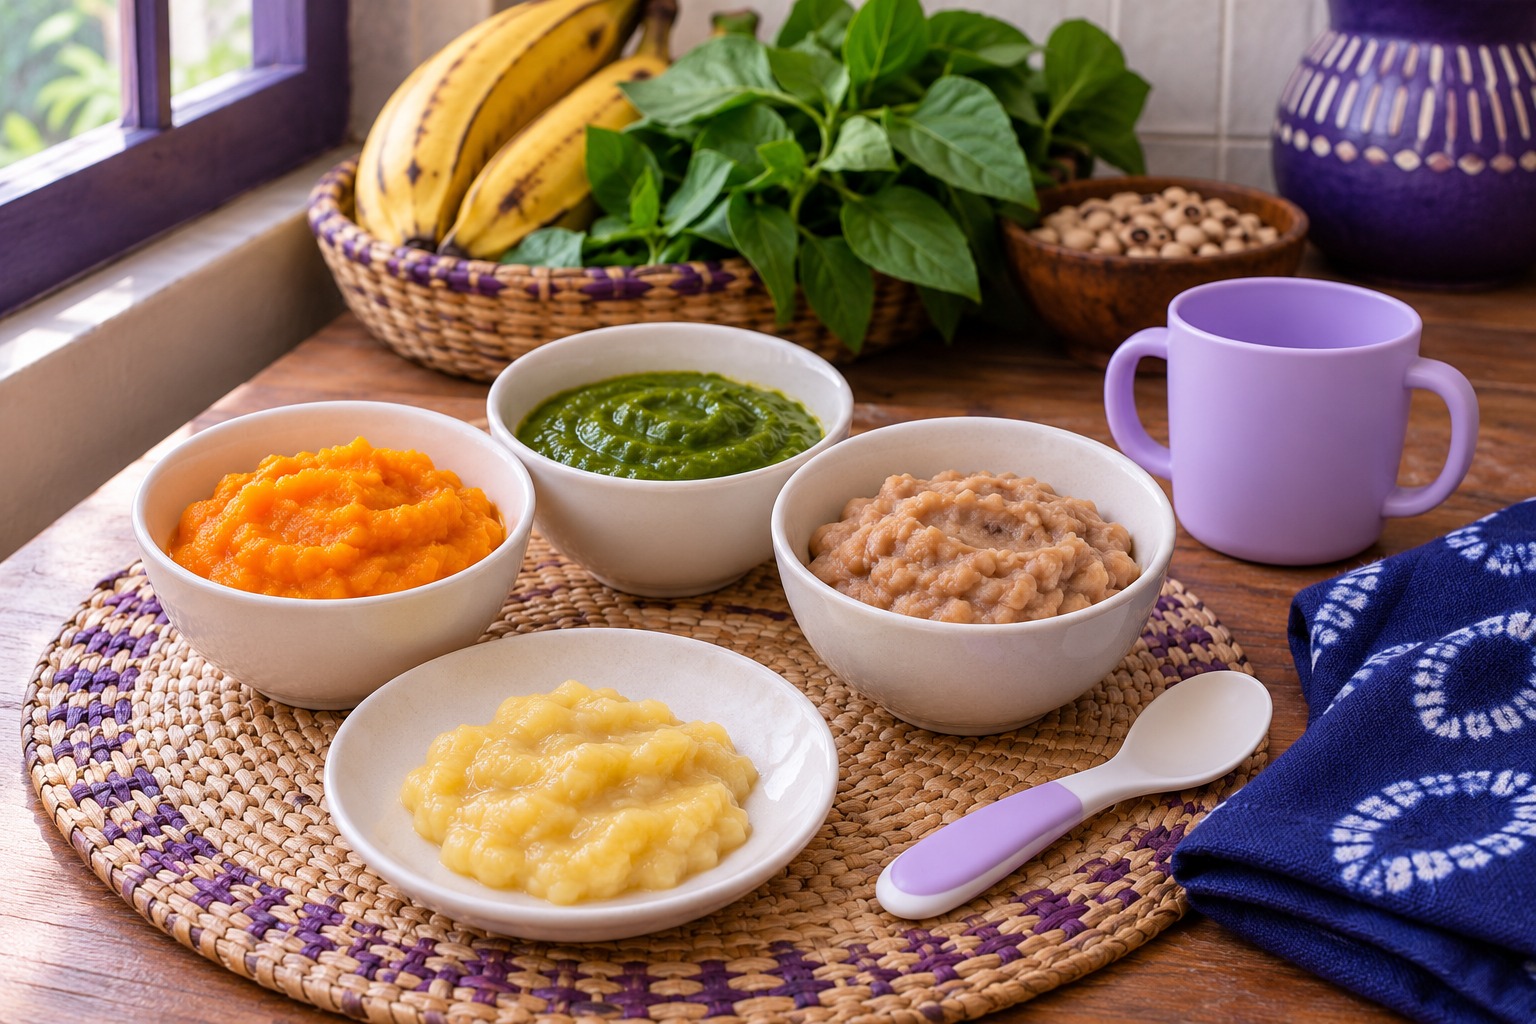
Featured image: AI-generated conceptual food-preparation still life. It is not a prescribed menu, portion guide, product test or photograph of study participants’ meals.
This report includes two original charts, a two-column review infographic and four free CSV tools. The worksheets separate a previous-day food record from an optional local-price log. We collected no Nigerian prices or child records, and the Ghanaian percentages remain clearly labelled as Ghanaian.
What the baby food quality study measured
The BMC Pediatrics paper by Mohammed and colleagues appeared on 4 November 2026. It analysed 2,786 youngest living children aged 6–23 months who lived with their mothers in the 2022 Ghana Demographic and Health Survey. Therefore, the publication date is not the date of a new 2026 feeding survey.
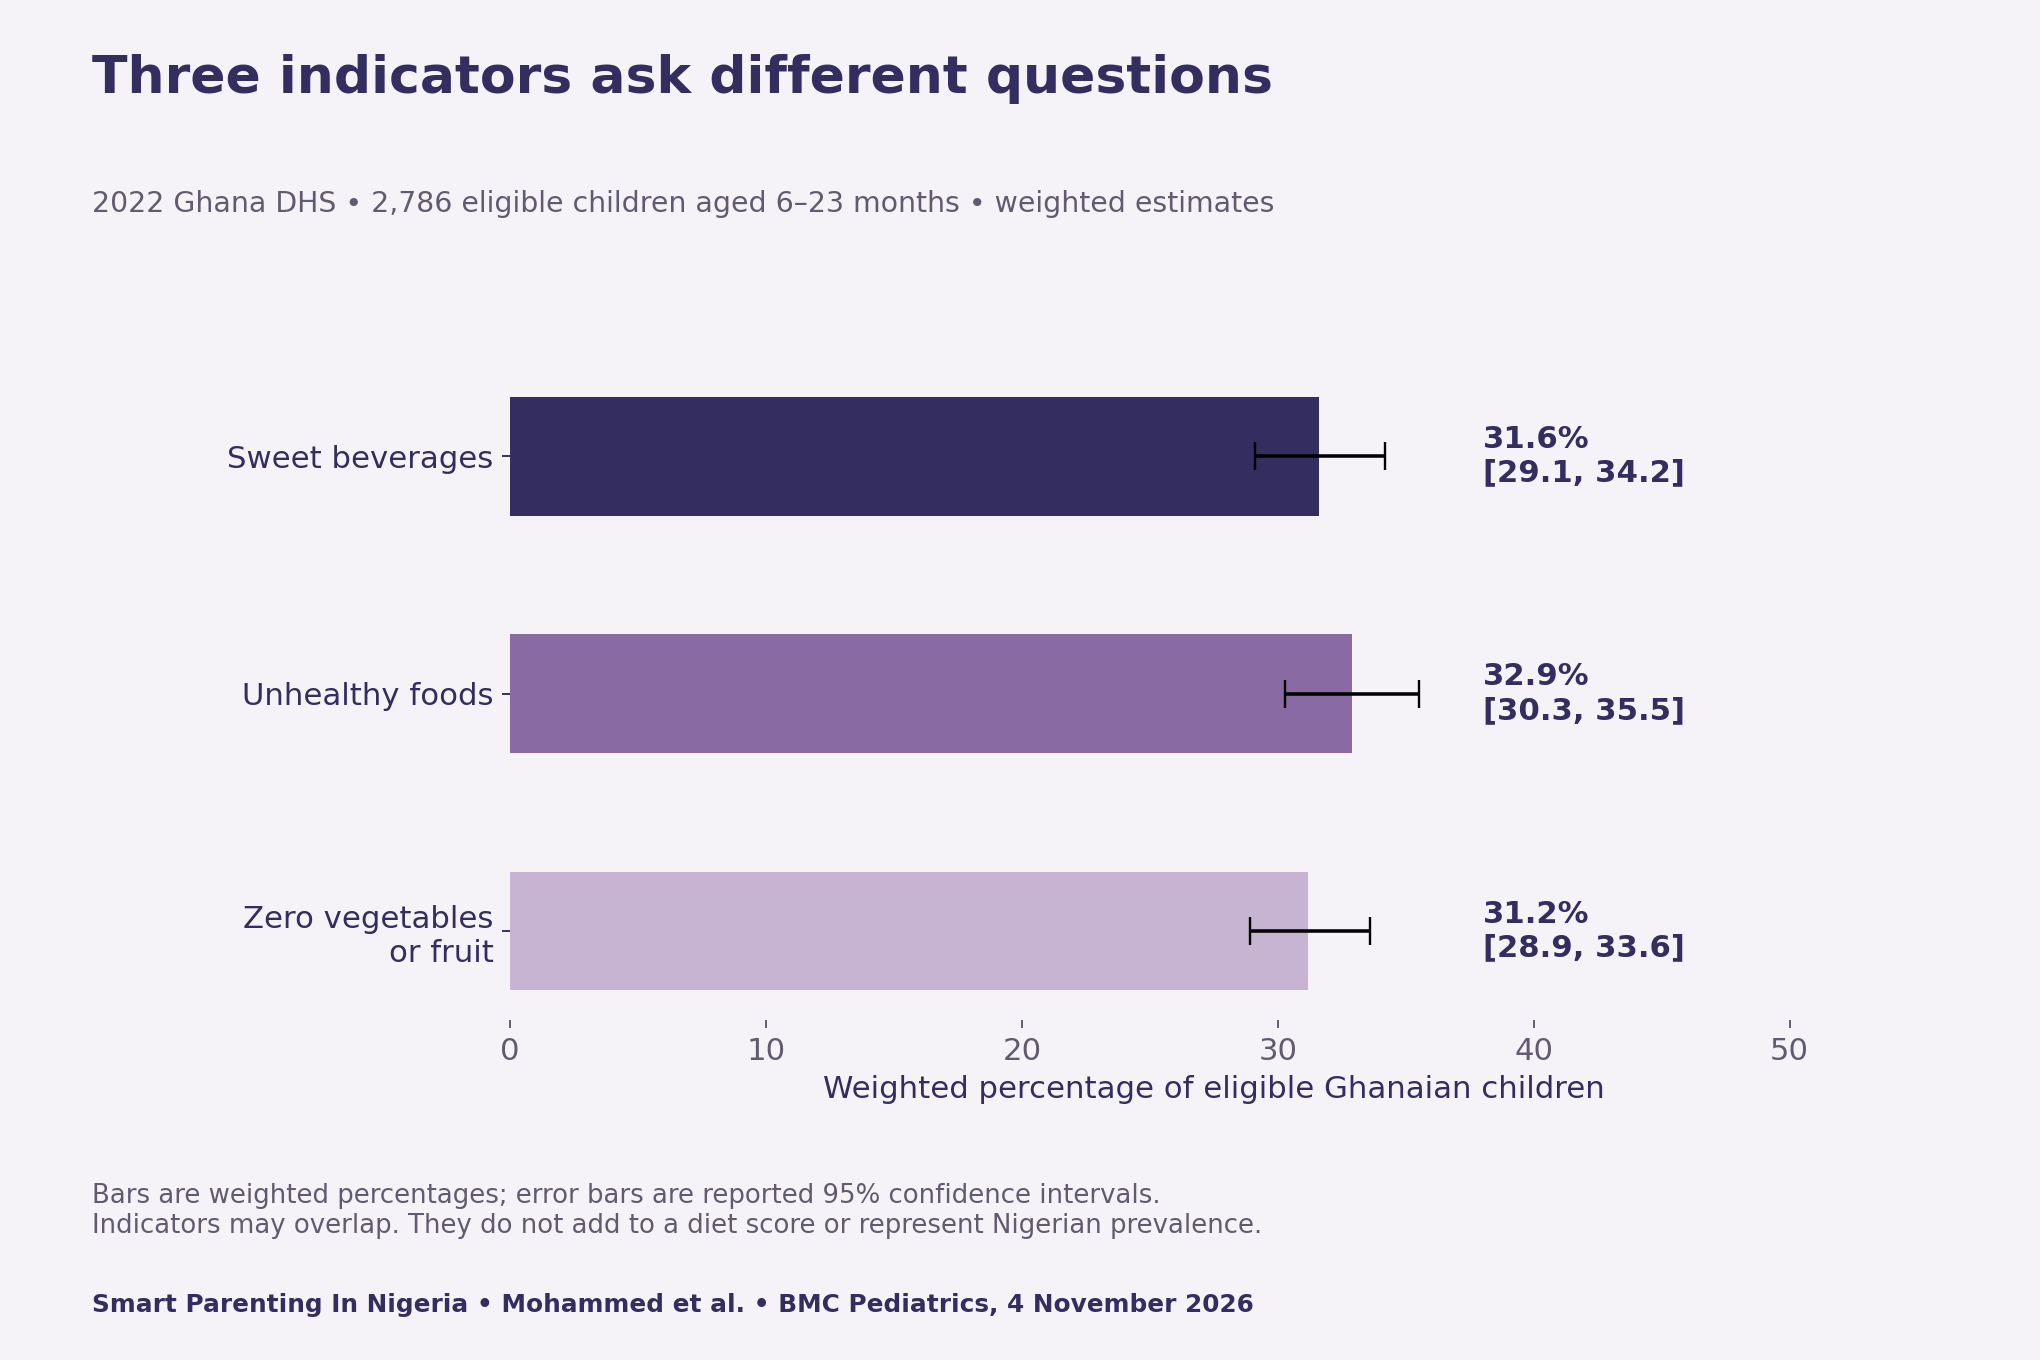
Its weighted estimates were 31.6% for sweet beverages, 32.9% for unhealthy foods and 31.2% for zero vegetables or fruit. These indicators can overlap. Their percentages are not portions of one exclusive diet category, and adding them would not produce a meaningful nutrition score.
Why the wealth comparison needs a reference line
For richest versus poorest households, the adjusted prevalence ratio for sweet beverages was 2.82, with a 95% confidence interval of 2.06–3.86. The selected unhealthy-food ratio was 1.49, with an interval of 0.98–2.28. The latter includes 1, so its uncertainty matters when describing that comparison.
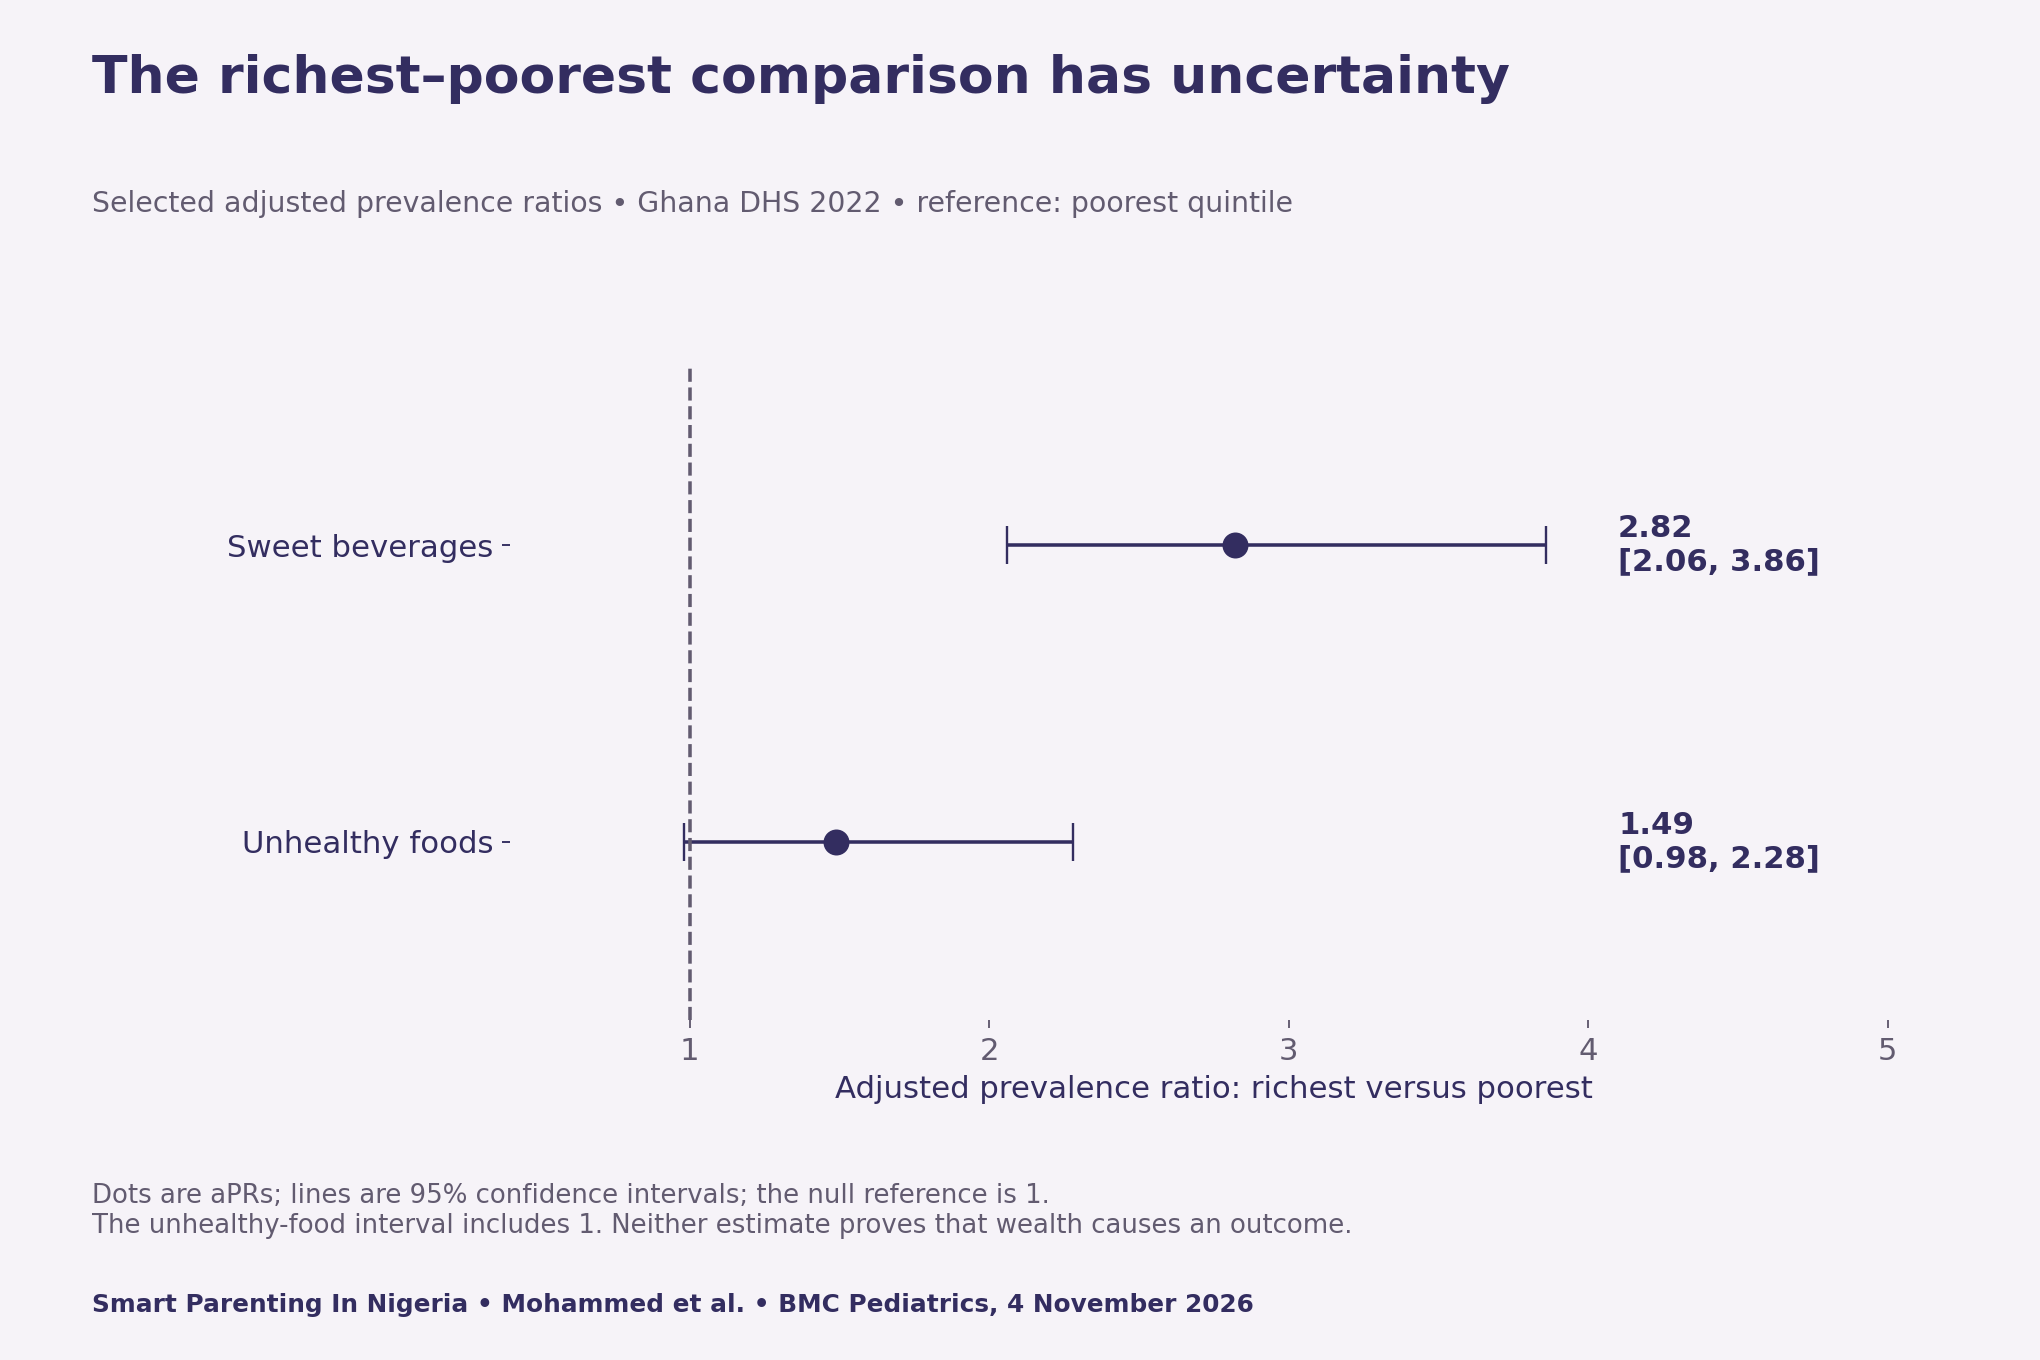
The paper measured household wealth through the survey’s asset-based index, not the amount a parent paid for a particular food basket. Consequently, this is not an experiment comparing cheap and expensive products. A price tag cannot replace information about what a child actually consumed.
Separate three baby food quality questions
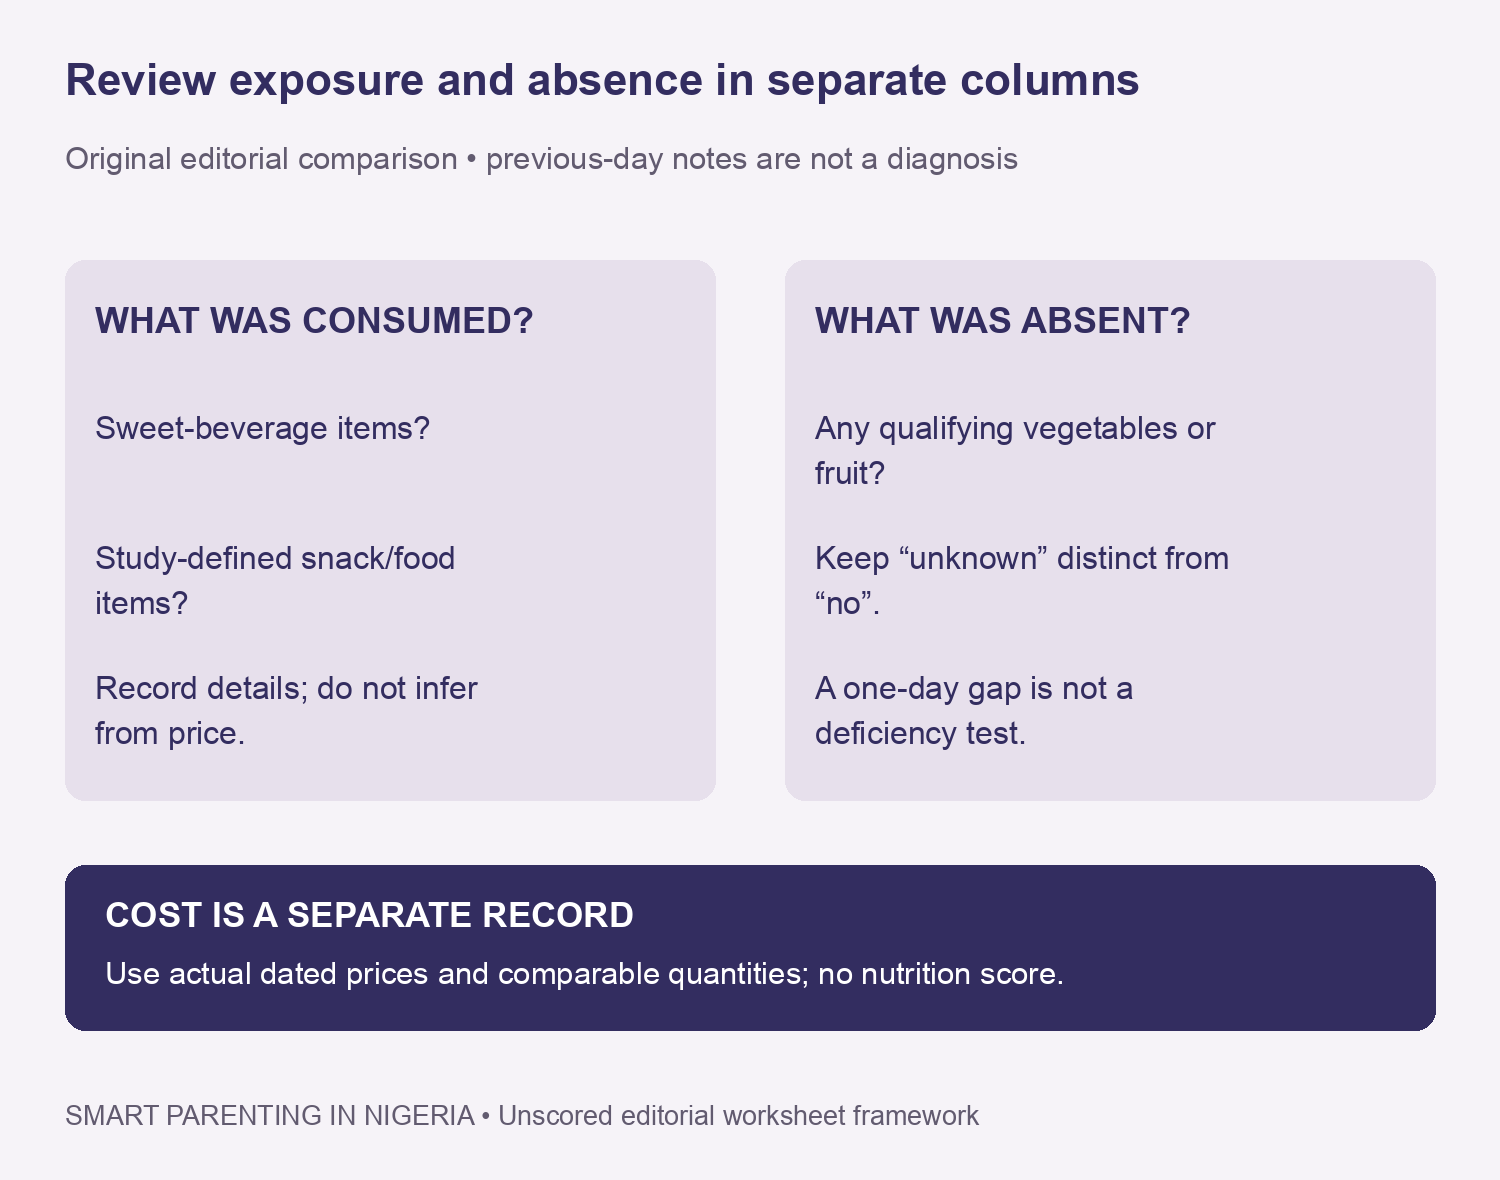
First, record the drink or food item rather than assuming its category from advertising. The study’s sweet-beverage definition included fruit juice as well as several sweetened drinks. Its unhealthy-food measure covered specified snack and food items. These are research definitions, not a laboratory test of every locally available product.
Second, keep the absence question separate. The WHO zero-vegetable-or-fruit indicator concerns the previous day. It does not diagnose a nutrient deficiency or describe a child’s usual intake from one observation. Starchy staples such as yam and cassava do not count as vegetables for this indicator simply because they come from plants.
Third, retain uncertainty. If an adult does not know what another caregiver served, record “unknown”. Do not silently turn that into “no”. A family conversation may clarify an entry, but the worksheet remains an original private planning aid rather than a validated household nutrition instrument.
| Review column | Record | Avoid concluding |
|---|---|---|
| Exposure | Actual drinks and foods, with ingredients if known | Expensive means healthy |
| Absence | Whether qualifying vegetables or fruit were reported yesterday | One day diagnoses a deficiency |
| Cost | Dated local price and comparable quantity | A lower price establishes nutritional adequacy |
Use the baby food quality recall sheet privately
The blank recall sheet asks for an item, description and whether it was consumed during the previous day or night. It also leaves room for uncertain ingredients or questions for a qualified professional. Keep completed notes private. Avoid adding the child’s name, address or medical details to a file you intend to share.
For example, an adult might need to check whether a drink contained juice or added sweetener. That is an editorial example of a question, not an invented observation about a Nigerian family. The file has no participant data and sends no completed responses to this website.
Keep local-price comparisons honest
The optional price log starts empty. Record the date, vendor alias, package price, package quantity and unit. If edible quantity is measured, identify its unit too. Otherwise leave it unresolved; do not pretend the package weight equals the amount available after preparation or waste.
For a fair comparison, match like quantities and dates before doing arithmetic. Preparation costs, spoilage and household access may also matter. However, this article supplies no local price ranking, tested recipe, affordability threshold or claim that the least expensive option meets every nutritional need.
Established feeding guidance still matters
The WHO complementary-feeding guideline dates to 16 October 2023 and covers ages 6–23 months. It is established guidance, not this week’s Ghana research. WHO’s infant and young-child feeding factsheet supports complementary foods from around six months alongside continued breastfeeding, with good hygiene and gradually appropriate consistency and variety.
Parenting Made Just for You
Get personalized Parenting Solutions tailored to your child’s needs. Transform your parenting journey with expert guidance in 1-3 days.
Get StartedThe Ghana analysis does not justify stopping breastfeeding. Nor do three indicators capture a complete diet, growth assessment, allergy history or feeding difficulty. Ask an appropriately qualified child-health professional about persistent feeding or growth concerns and a child’s individual needs. Avoid turning this worksheet into a supplement recommendation or an unsafe texture experiment.
Our general baby-growth nutrition guide covers a broader subject. This report instead audits three indicators and their uncertainty. For another example of keeping a questionnaire measure separate from clinical outcomes, see our screen-content evidence report.
Download the evidence and blank worksheets
The prevalence CSV preserves weighting, age range, country, survey year and uncertainty. The ratio file records the richest–poorest contrast and reference value. The remaining downloads are a blank private recall sheet and a blank dated price log. None is a complete diet score or diagnostic tool.
- Three Ghana weighted feeding indicators and intervals (CSV)
- Selected richest–poorest adjusted prevalence ratios (CSV)
- Blank private previous-day food recall (CSV)
- Blank dated local food-price log (CSV)
Methods, source version and limits
We checked the early-access publisher page, full accepted manuscript and WHO references on 9 November 2026. The charts use reported rounded estimates without refitting the survey models. The publisher says this accepted version remains subject to editing. The full WHO guideline download returned an access error; the accessible overview and established factsheet support the limited guidance summary here.
Recall, observational confounding and geographic transferability limit interpretation. No Nigerian prevalence, causal wealth effect or individual dietary diagnosis follows. Suggested citation: Smart Parenting In Nigeria, 9 November 2026, “Baby Food Quality: Spending Is Not a Diet Score”; study findings attributed to Mohammed and colleagues, DOI 10.1186/s12887-026-07992-z. The charts and unscored worksheets are original presentations.


